


Abstract
Atherosclerotic plaque characteristics play an important role in the development of coronary events. We investigated coronary plaque characteristics on multi-slice computed tomography (MSCT) and virtual histology intravascular ultrasound (VH IVUS) in patients with acute coronary syndromes (ACS) and stable coronary artery disease (CAD).
Fifty patients (25 with ACS, 25 with stable CAD) underwent 64-slice MSCT followed by VH IVUS in 48 (96%) patients. In ACS patients, 32% of plaques were non-calcified on MSCT and 59% were mixed [corresponding odds ratio (95% confidence intervals): 3.9 (1.6–9.5), P = 0.003 and 3.4 (1.6–6.9), P = 0.001, respectively]. In patients with stable CAD, completely calcified lesions were more prevalent (61%). On VH IVUS, the percentage of necrotic core was higher in the plaques of ACS patients (11.16 ± 6.07 vs. 9.08 ± 4.62% in stable CAD, P = 0.02). In addition, thin cap fibroatheroma was more prevalent in ACS patients (32 vs. 3% in patients with stable CAD, P < 0.001) and was most frequently observed in mixed plaques on MSCT. Plaque composition both on MSCT and VH IVUS was identical between culprit and non-culprit vessels of ACS patients.
On MSCT, differences in plaque characterization were demonstrated between patients with ACS and stable CAD. Plaques of ACS patients showed features of vulnerability to rupture on VH IVUS. Potentially, MSCT may be useful for non-invasive identification of atherosclerotic plaque patterns associated with higher risk.
Introduction
Despite improvement in medical therapy and use of novel interventional techniques, acute coronary syndromes (ACS) continue to be one of the leading causes of morbidity and mortality in developed countries. 1 In the occurrence of coronary events, atherosclerotic plaque characteristics (including degree of stenosis as well as composition) have been demonstrated to play a pivotal role. Based on pathological studies of the victims of sudden cardiac death, lesions containing a large amount of necrotic core with an overlying thin fibrous cap (referred to as thin cap fibroatheroma, TCFA) have been linked to plaque rupture. 2 , 3 With regard to the degree of stenosis, ACS may frequently arise from lesions with only mild to moderate stenosis since these lesions may be more common than severe obstructive lesions. 4–8
Accordingly, in vivo detection of potentially vulnerable plaques may improve prevention of cardiovascular events. Both invasive and non-invasive techniques are currently under development. Recently, virtual histology intravascular ultrasound (VH IVUS) has been introduced. This invasive imaging modality allows in vivo quantitative evaluation of four coronary plaque components, namely fibrotic tissue, fibro-fatty tissue, necrotic core and dense calcium. 9 Nasu et al . 10 recently showed that VH IVUS, as compared with histopathology, allowed detection of necrotic core with an accuracy of 88.3%, whereas the accuracy to detect dense calcium was as high as 96.5%. Non-invasively, plaque extent and composition may be evaluated by multi-slice computed tomography (MSCT) coronary angiography. 11–14 Previous studies have suggested that MSCT can recognize differences in coronary plaque composition with different clinical presentations, 15–18 although comparison with invasive imaging is lacking.
The purpose of the present study was to evaluate plaque characteristics in patients presenting with ACS and stable coronary artery disease (CAD) using both non-invasive MSCT and invasive VH IVUS.
Methods
Patient population and study protocol
Patients with ACS included unstable angina and non-ST-segment elevation myocardial infarction, defined according to the guidelines of the European Society of Cardiology 19 and the American College of Cardiology/American Heart Association. 20 The control group of the present study consisted of age- and gender-matched patients presenting at the out-patient clinic with stable angina pectoris and requiring conventional coronary angiography.
As part of the clinical evaluation, all patients underwent 64-slice MSCT coronary angiography, followed by invasive coronary angiography. Median interval between MSCT and invasive coronary angiography (with VH IVUS imaging during the same procedure) was 1 (range 0–2) day in patients presenting with ACS; patients with stable CAD underwent both procedures within 1 month. Patients with acute coronary events or worsening of angina between MSCT and invasive coronary angiography were excluded. Additional contraindications for MSCT were (supra-) ventricular arrhythmias, renal insufficiency (serum creatinine > 120 µmol/L), and known allergy to iodine contrast media. Exclusion criteria for IVUS were severe vessel tortuousness, severe luminal narrowing precluding insertion of IVUS catheter or vessel occlusion. In a previous study, we evaluated differences in plaque characteristics between patients with ACS and stable CAD with 16-slice MSCT. 18 In this study, 22 and 24 patients with ACS and stable CAD, respectively, were enrolled, showing statistically significant differences in plaque characteristics on MSCT between both groups. Based on these previous findings we decided to enrol 25 patients in each group. In total, 72 patients were initially selected for inclusion in the study. However, 22 patients could eventually not be included (11 patients did not undergo MSCT prior to angiography due to logistical reasons, eight had high heart rate and contraindications for β-blockers and three had severe renal dysfunction). As a consequence, 50 patients (25 presenting with ACS, 25 with stable CAD) scheduled for conventional coronary angiography were included in the study. Patient characteristics are provided in Table 1 .
Clinical characteristics of the study population
| Characteristics | ACS ( n = 25) | Stable CAD ( n = 25) | P -value |
|---|---|---|---|
| Male gender | 18 (72%) | 14 (56%) | 0.2 |
| Age (years) | 57 ± 11 | 61 ± 11 | 0.2 |
| Obesity | 3 (12%) | 5 (20%) | 0.4 |
| Type 2 diabetes mellitus | 3 (12%) | 6 (24%) | 0.5 |
| Hypercholesterolaemia | 17 (68%) | 18 (72%) | 0.8 |
| Hypertension | 11 (44%) | 16 (64%) | 0.2 |
| Family history of CAD | 13 (52%) | 12 (48%) | 0.8 |
| Smoking | 14 (56%) | 9 (36%) | 0.2 |
| Previous MI | 4 (16%) | 1 (4%) | 0.4 |
| Previous PCI | 7 (28%) | 2 (8%) | 0.1 |
ACS, acute coronary syndromes; CAD, coronary artery disease; MI, myocardial infarction; PCI, percutaneous coronary intervention.
The study protocol was approved by the ethics committee and informed consent was obtained from all patients.
Multi-slice computed tomography
Image acquisition
MSCT examination was performed using a 64-slice Toshiba Aquilion (Toshiba Medical Systems, Tokyo, Japan) scanner. The images were acquired with a collimation of 64 × 0.5 mm and a tube rotation of 0.4 s. The tube current was 300 or 350 mA at 120 or 135 kV, respectively. The contrast material (Iomeron 400, Bracco, Milan, Italy) was administered in an antecubital vein at a rate of 5 mL/s and the amount of 90–105 mL, depending on the total scan time. The timing of the start of the scan was performed using detection of automated peak enhancement in the descending aorta (baseline Hounsfield units + 100). Image acquisition was performed during an inspiratory breath hold of ∼10 s and during electrocardiographic gating. 21 If the heart rate was ≥65 beats/min additional oral β-blockers (metoprolol, 50 or 100 mg, single dose, 1 h prior to the examination) were provided if tolerated.
Images were reconstructed in the R–R interval phase showing least motion artefacts with a slice thickness of 0.5 mm and an increment of 0.3 mm. When extensive calcifications were present, sharper reconstruction kernels were used to reduce blooming artefacts of calcium. Subsequently, images were transferred to a remote workstation for post-processing and evaluation.
Image analysis
Images were evaluated using a remote workstation with dedicated software (Vitrea 2, Vital Images, USA). Two experienced observers who were unaware of the clinical history and IVUS findings assessed MSCT angiograms side-by-side in consensus. Coronary plaques were visually evaluated on axial images and curved multiplanar reconstructions. Structures > 1 mm 2 within and/or adjacent to the coronary artery lumen, which could be clearly distinguished from the vessel lumen and the surrounding tissue were regarded as plaques. 12 The location of plaques in the arteries was defined using side branches and coronary ostia as landmarks. Plaques were classified into three types, namely non-calcified (plaques having lower density compared with the contrast-enhanced vessel lumen without any visible calcification), calcified (plaques with predominantly high density) and mixed (plaques with non-calcified and calcified elements within the same plaque).
The left main coronary artery was considered part of the left anterior descending coronary artery and the intermediate branch was considered part of the left circumflex coronary artery.
Virtual histology intravascular ultrasound
Image acquisition
For each IVUS examination, a 20 MHz, 2.9 F, phased-array IVUS catheter (Eagle Eye, Volcano Corporation, Rancho Cordova, CA, USA) was used. After administration of intracoronary nitrates, the IVUS catheter was introduced to the distal coronary artery. Using automated pullback device, the transducer was withdrawn at a continuous speed of 0.5 mm/s up to the coronary ostium. Cine runs before and during contrast injection were performed to define the starting position of the IVUS catheter. Image acquisition was carefully monitored for gating or IVUS catheter pullback disturbances. The electrocardiographically triggered IVUS radiofrequency signals were acquired and stored for off-line analysis.
Image analysis
Off-line VH IVUS analyses were performed using dedicated software (pcVH 2.1, Volcano Corporation, Rancho Cordova, CA, USA) by two experienced observers blinded to baseline patient characteristics. The location of coronary plaques (detected on MSCT) was identified using side branches and coronary ostia as landmarks. The repeated frames due to non-continuous pullback of the IVUS catheter were excluded from analysis. When drawing the lumen contours, the presence of thrombus was visually assessed, and if present, not included as plaque. For each region of interest, relative compositional quantitative plaque parameters were obtained. Four tissues were differentiated including fibrotic tissue being labelled in dark green, fibro-fatty in light green, necrotic core in red and dense calcium in white ( Figure 1 ). In addition, the presence of IVUS-derived TCFA was evaluated, which was defined as a lesion fulfilling the following criteria: (i) plaque burden > 40%, (ii) the presence of confluent necrotic core of >10%, and (iii) no evidence of an overlying fibrous cap ( Figure 1 ), as previously described by Rodriguez-Granillo et al . 3 , 22 , 23
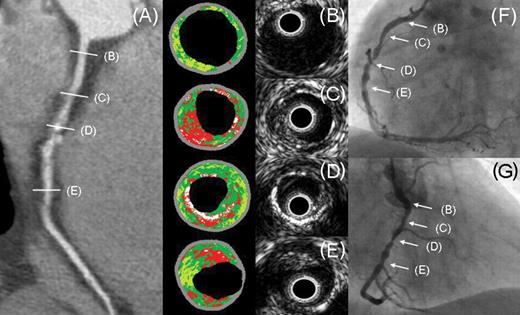
Coronary plaques in the culprit vessel of a patient presenting with unstable angina pectoris: ( A ) Multi-slice computed tomography (MSCT) multiplanar reconstruction of the right coronary artery showing obstructive non-calcified and mixed plaques. ( B ) to ( E ) Grey-scale intravascular ultrasound (IVUS) images and the corresponding VH (virtual histology) IVUS images. In ( B ), small amount of plaque in the proximal right coronary artery is seen, which appears normal on MSCT. TCFA (thin cap fibroatheroma) with a large amount of necrotic core is detected in proximally and distally located non-calcified plaques of the right coronary artery ( C ) and ( E ). A corresponding cross-section of a mixed plaque in the mid-right coronary artery shows plaque with calcium on VH IVUS ( D ). Multiple obstructive stenoses in the right coronary artery were confirmed on invasive coronary angiography ( F ) and ( G ). VH IVUS plaque components: dark green indicates fibrotic tissue; light green, fibro-fatty tissue; red, necrotic core; white, dense calcium.
Definition of the region of interest on multi-slice computed tomography and virtual histology intravascular ultrasound
The average of four plaque components on VH IVUS was calculated in the full length of plaques observed on MSCT. To ensure that identical plaques were assessed by MSCT and VH IVUS, coronary ostia and side branches were used as landmarks and distances from the landmarks to the target lesions were measured. The distances were measured on curved multiplanar reconstructions of the coronary arteries on MSCT. On IVUS, the corresponding plaque was identified using longitudinally reconstructed IVUS data sets. 12 The transversal IVUS sections were further inspected and the start and finish frames of the lesions were depicted on electrocardiographically triggered IVUS data sets.
Statistical analysis
Initial analyses were performed on a coronary plaque level. Coronary plaque characteristics on MSCT and VH IVUS were compared between patients presenting with ACS and stable CAD. Continuous variables with normal distribution were expressed as means (with standard deviation) and compared with the t -test for independent samples. When not normally distributed, continuous variables were expressed as medians (with interquartile range) and compared using the non-parametric Mann–Whitney test. Categorical variables were expressed as numbers (with percentages) and compared between groups with χ 2 test or Fisher’s exact test. To account for possible interdependencies between multiple plaques within a patient, differences in plaque composition between patients presenting with ACS and stable CAD were evaluated by logistic regression analysis with the application of generalized estimating equation method. 24 Odds ratios (OR) and 95% confidence intervals (CI) were reported.
In addition, plaque characteristics were compared between culprit and non-culprit vessels of ACS patients. Culprit vessels were defined as vessels containing the culprit lesion. The latter was identified by angiographic lesion morphology (as determined on conventional coronary angiograms), ECG findings and/or regional wall motion abnormalities on left ventriculography or echocardiography. 6 Continuous variables with normal distribution were expressed as means (with standard deviation) and compared with the t -test for independent samples. When not normally distributed, continuous variables were expressed as medians (with interquartile range) and compared using the non-parametric Mann–Whitney test. Categorical variables were expressed as numbers (with percentages) and compared between groups with χ 2 test. To account for possible interdependencies between multiple plaques within a patient, differences in plaque composition between culprit and non-culprit vessels were evaluated by logistic regression analysis with the application of generalized estimating equation method.
Differences between plaque characteristics between patients presenting with ACS and stable CAD were also evaluated on a patient level. For this purpose, univariable analysis followed by multivariable logistic regression analysis was performed. The linearity assumption for all continuous variables (age, number of non-calcified, mixed and calcified plaques, mean percentage of fibrotic, fibro-fatty tissues, necrotic core and dense calcium as well as number of TCFA per patient) was assessed as follows: first, continuous variables were divided into meaningful subgroups. Subsequently, the log odds were calculated for each subgroup and plotted against the midpoint. The assumption of linearity was satisfied as a stepwise change in the odds was observed when moving between the adjacent categories of each variable. The final multivariable analysis model included baseline characteristics showing correlation at a significance level of P < 0.1 in the univariable analysis (the presence of hypertension and the history of previous percutaneous coronary intervention, Table 2 ). In addition, since plaque observations are influenced by patient age and gender, age and gender were included as covariates of the multivariable analysis regardless of the significance level of correlation in the univariable analysis.
Correlation between baseline patient characteristics and clinical presentation with acute coronary syndromes
| MSCT parameter | Univariable | |
|---|---|---|
| OR (95% CI) | P -value | |
| Age | 1.0 (0.97–1.1) | 0.2 |
| Male gender | 2.0 (0.6–6.6) | 0.2 |
| Obesity | 1.8 (0.4–8.7) | 0.4 |
| Type 2 diabetes mellitus | 2.3 (0.5–10.5) | 0.3 |
| Hypercholesterolaemia | 1.2 (0.4–4.1) | 0.8 |
| Hypertension | 2.3 (0.7–7.0) | 0.09 |
| Family history of CAD | 0.9 (0.3–2.6) | 0.8 |
| Smoking | 0.4 (0.1–1.4) | 0.2 |
| Previous MI | 0.2 (0.02–2.1) | 0.2 |
| Previous PCI | 0.2 (0.4–1.2) | 0.08 |
| Use of statins | 1.7 (0.5–5.3) | 0.4 |
CAD, coronary artery disease; CI, confidence intervals; MI, myocardial infarction; OR, odds ratio; PCI, percutaneous coronary intervention.
All analyses were two-tailed and P -values < 0.05 were considered as statistically significant. Statistical analyses were performed using SPSS (version 12.0, SPSS Inc., Chicago, IL, USA) and SAS (release 6.12, SAS institute, Cary, NC, USA) software.
Results
Patient characteristics
Baseline characteristics of patients presenting with ACS and stable CAD are provided in Table 1 . No differences were observed in the prevalence of CAD risk factors and the use of medication between the two patient groups. All ACS patients presented with chest pain and ECG abnormalities, whereas troponin levels were elevated in six (24%) patients.
Plaque characteristics in patients with acute coronary syndromes vs. stable coronary artery disease
Multi-slice computed tomography
Non-invasive MSCT angiograms of all patients were of diagnostic image quality and were included in the analysis. Coronary plaques were detected in all 50 patients and in 150 vessels (75 vessels in ACS patients and 75 vessels in patients with stable CAD). In total, 179 and 118 plaques were observed in patients with ACS and stable CAD, respectively. In general, more plaques were observed in ACS patients [median 7 (plaques), range 5–10] as compared with patients with stable CAD [median 5 (plaques), range 2–7, P = 0.04]. Non-obstructive plaques were more prevalent in ACS patients as compared with patients with stable CAD (median 5, range 3–7 vs. median 3, range 2–5, P = 0.03). No difference in the number of obstructive plaques was observed (median 2, range 0–4 in ACS patients vs. median 0, range 0–3 in patients with stable CAD, P = 0.2).
The findings on coronary plaque composition on MSCT in patients presenting with ACS vs. stable CAD are presented in Tables 3 and 4 . Relatively more plaques in patients presenting with ACS were either non-calcified or mixed (corresponding OR 3.9, P = 0.003 and 3.4, P = 0.001, respectively). In contrast, lesions were less frequently calcified (corresponding OR 0.06, P < 0.001) ( Table 3 ). To account for within patient correlations, analysis was performed on a patient level using multivariable analysis. As shown in Table 4 , the correlation between the clinical presentation with ACS and the increasing number of non-calcified and mixed plaques as well as a lower number of calcified plaques remained significant on a patient level.
Correlation of coronary plaque composition on multi-slice computed tomography with clinical presentation with acute coronary syndromes as compared with stable coronary artery disease (plaque level logistic regression analysis with the application of generalized estimating equation method)
| Plaque characteristics | ACS (plaque n = 179) | Stable CAD (plaque n = 118) | OR (95% CI) | P -value a |
|---|---|---|---|---|
| Number of non-calcified plaques | 57 (32%) | 14 (12%) | 3.9 (1.6–9.5) | 0.003 |
| Number of mixed plaques | 105 (59%) | 32 (27%) | 3.4 (1.6–6.9) | 0.001 |
| Number of calcified plaques | 17 (9%) | 72 (61%) | 0.06 (0.02–0.2) | <0.001 |
ACS, acute coronary syndromes; CAD, coronary artery disease; CI, confidence intervals; OR, odds ratio.
aP -value refers to logistic regression analysis with the application of generalized estimating equation method.
Correlation of coronary plaque composition on multi-slice computed tomography with clinical presentation with acute coronary syndromes [patient level analysis (with the relations adjusted for age, gender, the presence of hypertension and the history of previous percutaneous coronary intervention)]
| MSCT parameter | Multivariable | |
|---|---|---|
| OR (95% CI) | P -value | |
| Number of non-calcified plaques | 2.2 (1.3–3.9) | 0.006 |
| Number of mixed plaques | 1.9 (1.2–3.0) | 0.004 |
| Number of calcified plaques | 0.5 (0.3–0.8) | 0.005 |
| MSCT parameter | Multivariable | |
|---|---|---|
| OR (95% CI) | P -value | |
| Number of non-calcified plaques | 2.2 (1.3–3.9) | 0.006 |
| Number of mixed plaques | 1.9 (1.2–3.0) | 0.004 |
| Number of calcified plaques | 0.5 (0.3–0.8) | 0.005 |
MSCT, multi-slice computed tomography; CI, confidence intervals; OR, odds ratio.
Virtual histology intravascular ultrasound: quantitative evaluation
VH IVUS was successfully performed in 48 (96%) patients (including 23 patients with ACS and 25 with stable CAD) and in 103 vessels (50 vessels in ACS patients, 53 vessels in patients with stable CAD). VH IVUS was not performed in two patients due to severely obstructive disease in the proximal coronary segments. In total, IVUS was available in 97 coronary plaques of patients with ACS and 61 plaques of patients with stable CAD. An example of plaque composition on MSCT with the corresponding VH IVUS images is provided in Figure 1 .
No differences were observed in the amount of fibrotic tissue (59.37 ± 7.73 vs. 56.73 ± 10.1%, P = 0.07), fibro-fatty tissue (23.92 ± 10.15 vs. 27.11 ± 11.36%, P = 0.07) and the amount of dense calcium (5.55 ± 5.13 vs. 7.09 ± 9.28%, P = 0.18) in plaques of the two patient populations. The amount of necrotic core, however, was larger in plaques of patients with ACS (11.16 ± 6.07 vs. 9.08 ± 4.62%, P = 0.02) ( Figure 2 A ). No correlation between plaque components and clinical presentation with ACS was observed when analysis was performed on a patient level ( Table 5 ).
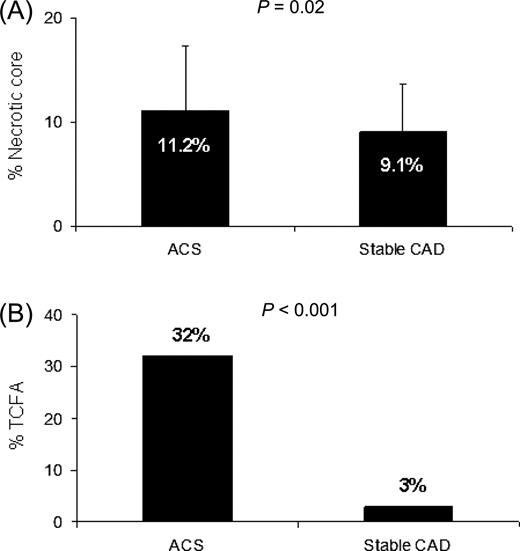
Amount of necrotic core and prevalence of thin cap fibroatheroma (TCFA) in plaques of patients presenting with acute coronary syndromes (ACS) and with stable coronary artery disease (CAD). ( A ) A larger amount of necrotic core was observed in plaques of patients with ACS as compared with patients with stable CAD. ( B ) TCFA were more frequently observed in plaques of patients with ACS as compared with patients with stable CAD.
Correlation of coronary plaque composition on virtual histology intravascular ultrasound with clinical presentation with acute coronary syndromes [patient level analysis (with the relations adjusted for age, gender, the presence of hypertension and the history of previous percutaneous coronary intervention)]
| MSCT parameter | Multivariable | |
|---|---|---|
| OR (95% CI) | P -value | |
| Percentage of fibrotic tissue | 1.1 (1.0–1.2) | 0.3 |
| Percentage of fibro-fatty tissue | 1.0 (0.9–1.1) | 0.5 |
| Percentage of necrotic core | 1.1 (0.9–1.2) | 0.5 |
| Percentage of dense calcium | 0.9 (0.7–1.1) | 0.3 |
| Number of TCFA | 12.0 (1.7–85.6) | 0.01 |
MSCT, multi-slice computed tomography; TCFA, thin cap fibroatheroma; CI, confidence intervals; OR, odds ratio.
Virtual histology intravascular ultrasound: qualitative evaluation
Qualitative evaluation of coronary plaques showed the presence of TCFA in 31 of 97 (32%) plaques of patients with ACS, whereas only two of 61 (3%) plaques of patients with stable CAD had features of TCFA ( P < 0.001) ( Figure 2 B ). When data were analysed on a patient level, this correlation between an increased number of TCFA and clinical presentation with ACS remained ( Table 5 ). In ACS patients, VH IVUS-derived TCFA were most frequently observed in lesions classified as mixed (68%) on MSCT as compared with non-calcified (19%) and calcified plaques (13%, P = 0.001) on MSCT. All TCFA were located in mixed plaques of patients with stable CAD (100%).
Plaque characteristics in culprit vessels vs. non-culprit vessels
Multi-slice computed tomography
In ACS patients, 25 culprit and 50 non-culprit vessels were analysed. In total, 72 plaques were observed in culprit arteries and 107 in non-culprit arteries. The median number of plaques in culprit vessels was slightly higher as compared with non-culprit vessels [median 3 (plaques), range 2–4 vs. median 2 (plaques), range 1–4, P = 0.06, respectively].
Concerning plaque composition, no differences in the distribution of plaque types were observed between culprit and non-culprit vessels ( Table 6 ). Both in culprit and non-culprit vessels, mixed plaques were noted most often, followed by non-calcified plaques, whereas calcified plaques had the lowest prevalence.
Correlation of coronary plaque composition on multi-slice computed tomography with plaque localization in culprit vessels as compared with non-culprit vessels of patients with acute coronary syndromes (plaque level logistic regression analysis with the application of generalized estimating equation method)
| Plaque characteristics | Culprit vessels (plaque n = 72) | Non-culprit vessels (plaque n = 107) | OR (95% CI) | P -value a |
|---|---|---|---|---|
| Number of non-calcified plaques | 19 (26%) | 38 (36%) | 0.6 (0.3–1.2) | 0.2 |
| Number of mixed plaques | 44 (61%) | 61 (57%) | 1.2 (0.6–2.2) | 0.6 |
| Number of calcified plaques | 9 (13%) | 8 (7%) | 1.8 (0.6–5.3) | 0.3 |
CI, confidence intervals; OR, odds ratio.
aP -value refers to logistic regression analysis with the application of generalized estimating equation method.
Virtual histology intravascular ultrasound: quantitative evaluation
VH IVUS was performed in 19 culprit and 31 non-culprit vessels of ACS patients. In total, 39 plaques were located in culprit arteries and 58 plaques in non-culprit arteries. Similar to MSCT, no differences were observed between plaque composition in culprit and non-culprit arteries on VH IVUS. Plaques of the two groups of arteries showed no differences in the amount of fibrotic tissue (57.99 ± 6.95 vs. 60.3 ± 8.13%, P = 0.15), fibro-fatty tissue (26.3 ± 10.23 vs. 22.32 ± 9.86%, P = 0.06) and dense calcium (5.35 ± 4.86 vs. 5.69 ± 5.35%, P = 0.75). Of interest, no difference was demonstrated in the amount of necrotic core either (10.36 ± 5.62 vs. 11.69 ± 6.35%, P = 0.29) ( Figure 3 A ).
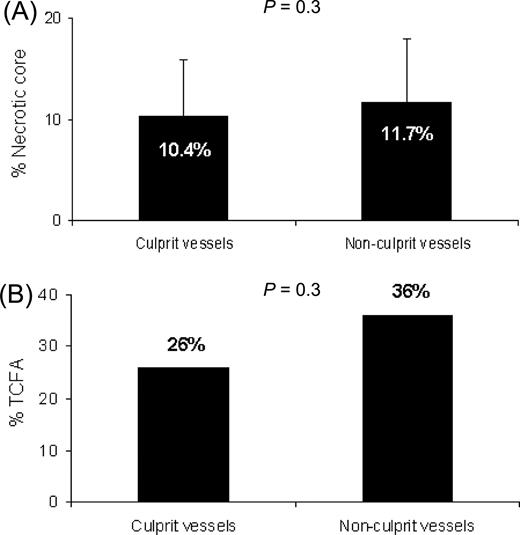
Amount of necrotic core and prevalence of thin cap fibroatheroma (TCFA) in plaques located in culprit and non-culprit vessels of patients with ACS (acute coronary syndromes). ( A ) Plaques located in culprit and non-culprit vessels contained identical amount of necrotic core. ( B ) Proportion of plaques having features of TCFA on VH IVUS (virtual histology intravascular ultrasound) was identical in culprit and non-culprit vessels.
Virtual histology intravascular ultrasound: qualitative evaluation
Importantly, the proportion of TCFA was similar in plaques of culprit and non-culprit arteries (26 vs. 36%, P = 0.27) ( Figure 3 B ).
In culprit vessels, plaques having features of TCFA were most frequently observed in mixed plaques (50%) as compared with non-calcified (20%) and calcified plaques (30%, P = 0.006) on MSCT. This proportion was similar also in non-culprit vessels, where TCFA was observed in 76% of mixed plaques, 19% of non-calcified, and 5% of calcified plaques ( P = 0.007) on MSCT.
Discussion
The findings of coronary plaque characterization using MSCT angiography and VH IVUS may be summarized as follows. First, the proportion of completely calcified plaques on MSCT was lower in patients with ACS, while non-calcified and mixed plaques were more prevalent as compared with patients with stable CAD. This observation corresponded with a larger amount of necrotic core and a higher prevalence of TCFA on VH IVUS in the plaques of ACS patients.
Secondly, multiple non-calcified and mixed plaques on MSCT were observed in both culprit and non-culprit vessels of patients presenting with ACS. No differences in plaque composition between non-culprit and culprit vessels were observed on VH IVUS.
Of interest, TCFA as detected by VH IVUS were most frequently observed in mixed plaques on MSCT.
Differences in plaque composition between acute coronary syndromes patients and patients with stable coronary artery disease
In the present study, MSCT revealed more diffuse CAD and more non-calcified and mixed plaques in patients with ACS as compared with patients with stable CAD. A higher prevalence of less calcified plaques on MSCT in ACS patients was also reported by Hoffmann et al . 17 who compared 14 patients with ACS to nine patients with stable CAD. Other studies have reported similar observations. 15–18 However, these investigations lacked validation against invasive plaque imaging, although dedicated grey-scale IVUS studies have shown comparable results. 25
Important features of plaque vulnerability may include a large amount of necrotic core and the presence of TCFA, as demonstrated in previous pathological studies. 2 , 3 Also in the present study, increased necrotic core was demonstrated with VH IVUS in the plaques of patients with ACS as compared with patients with stable CAD. In addition, 94% of the identified TCFA were observed in ACS patients.
Interestingly, completely calcified plaques on MSCT were more prevalent in patients with stable CAD, although the amount of calcium on VH IVUS was similar between the two groups. A possible explanation may be the fact that calcium in comparison with non-calcified tissue is generally overestimated on MSCT. 14 A more likely explanation, however, may be the fact that ACS in the present study was associated with a higher number of coronary plaques. Moreover, these lesions were often classified as mixed (containing both non-calcified and calcified tissues) on MSCT. Thus, although the total amount of calcium was similar on VH IVUS, more plaques that also contained non-calcified tissue were observed on MSCT in ACS patients. This observation may have implications for calcium scoring. Indeed, among individual patients, similar calcium scores may correspond to considerably different degrees of non-calcified tissue. Accordingly, the presence of relatively more mixed plaques as compared with calcified plaques may be associated with increased risk 26 but is not appreciated if only calcium scoring is performed.
Plaque composition in culprit and non-culprit vessels
Another important finding of the study is that both invasive and non-invasive imaging showed similar plaque features in culprit and non-culprit vessels. On MSCT, lesions in ACS tended to be equally distributed, as reflected by a similar number of lesions per vessel and similar plaque composition in two types of vessels. On VH IVUS this observation was paralleled by a similar amount of necrotic core and an equal distribution of TCFA. The observation that plaques with features of vulnerability also occur in non-culprit vessels is in line with previous studies using invasive coronary angiography, grey-scale, and VH IVUS. 22 , 27–29 Recently, Rodriguez-Granillo et al . also reported a larger proportion of necrotic core even in non-culprit vessels of ACS patients as compared with stable CAD patients. 28 In addition, a higher prevalence of TCFA in non-culprit vessels as compared with vessels of patients with stable CAD has been demonstrated. 22 In line with these findings, elevated levels of inflammatory markers have been observed in ACS patients, reflecting the presence of generalized inflammation which may result in the development of multiple unstable coronary lesions in the entire coronary tree. 30 , 31 These observations further support the hypothesis of a pan-coronary distribution of potentially vulnerable plaques in patients with ACS, which may lead to recurrent events within months following the initial presentation of CAD in this population. 27 , 32–34
Mixed plaques on multi-slice computed tomography vs. thin cap fibroatheroma on virtual histology intravascular ultrasound
Interestingly, TCFA was most frequently detected on VH IVUS in plaques that were classified as mixed on MSCT. Indeed, as previously suggested, lesions containing smaller calcium deposits (which are classified as mixed or non-calcified lesions on MSCT) may be more prevalent in ACS patients and could suggest plaque vulnerability. 25 , 35–37 Ehara et al . 35 compared patients with acute myocardial infarction or unstable angina with patients with stable CAD using grey-scale IVUS, and demonstrated more plaques with small calcium deposits as the culprit lesions in ACS patients. Similarly, a higher prevalence of these so-called spotty calcifications has recently been reported on MSCT. 38 Accordingly, it has been suggested that mixed plaques may represent vulnerable plaques on MSCT.
Clinical implications
Although risk stratification is currently based on clinical data, plaque characterization on non-invasive MSCT coronary angiography could be of use. In the present study, differences in coronary plaque patterns were demonstrated between ACS patients and patients with stable CAD. The presence of high-risk features was observed in these plaques on VH IVUS. Accordingly, MSCT may allow recognition of atherosclerotic plaque patterns representing relatively higher risk. Initial follow-up data have recently become available and have demonstrated the independent prognostic value of MSCT observations over baseline patient clinical characteristics. 26 , 39 However, prognostic data of plaque composition on MSCT are scarce 26 and larger outcome studies are highly needed. Patients with lower risk should be addressed in particular, since these patients would benefit most from non-invasive risk stratification with MSCT. Due to lack of prospective data, however, current guidelines do not recommend evaluation of coronary plaques for risk stratification. 40 VH IVUS on the contrary may be useful to evaluate individual plaques in patients with higher risk. Indeed, whereas grey-scale IVUS is suboptimal in assessment of vulnerable plaque, 41 VH IVUS may potentially allow better detection of features associated with future plaque rupture. Accordingly, the technique may be useful for individualized risk assessment and permit identification of patients who may benefit from aggressive medical therapy. 42 Large prospective studies however are awaited.
Limitations
Some limitations of the study should be acknowledged. The findings of the study are based on a relatively small patient population and further studies in larger patient cohorts are needed. The study provides observational data and follow-up data were not available. In addition, only visual assessment of plaque composition on MSCT was performed and plaque density was not measured. Indeed, it remains uncertain whether these measurements are reproducible since variations in contrast attenuation as well as scan settings may highly influence the results. 43 , 44
Concerning MSCT in general, the technique is still associated with intravenous contrast administration and a high radiation dose. However, substantial effort is invested in dose reduction strategies. Accordingly, the radiation exposure is expected to decrease in the near future. Indeed, considerable dose reduction was recently reported using a prospective gating protocol that allowed the acquisition of high-quality images with an average radiation dose as low as 2.1 mSv. 45
An important limitation of VH IVUS is the fact that the technique is relatively new and not yet widely available. Accordingly, the current observations need confirmation in future studies. Moreover, the currently used 20 and 30 MHz IVUS catheters allow longitudinal resolution of ∼250 µm while the use of 40 MHz IVUS catheters would potentially improve spatial resolution of VH IVUS. 46
Finally, intra- and inter-observer variability of MSCT and VH IVUS was not evaluated in the present study, as good agreement has been reported previously for both techniques. 14 , 47 , 48
Conclusions
More plaques containing non-calcified tissue were observed on MSCT in ACS patients as compared with patients with stable CAD. On VH IVUS, these observations were paralleled with a higher prevalence of TCFA in plaques of ACS patients. Moreover, both techniques showed similar findings in culprit and non-culprit vessels of ACS patients, suggesting diffuse inflammation. Features of high risk on VH IVUS were most frequently observed in mixed plaques on MSCT. Potentially, MSCT may be useful for non-invasive identification of atherosclerotic plaque patterns associated with higher risk, although prospective studies in patients with lower risk are needed to confirm these observations.
Funding
G.P. is financially supported by the training fellowship grant of the European Society of Cardiology, Huygens scholarship and Toshiba Medical Systems Europe; J.W.J. is an established investigator of the Netherlands Heart Foundation, grant number 2001T032; J.J.B. has research grants from GE Healthcare and BMS Medical Imaging.
Conflict of interest: none declared.

