1994-07-01
Vizualizing Interfirm Comparison
Publication
Publication
Omega , Volume 22 - Issue 4 p. 331- 338
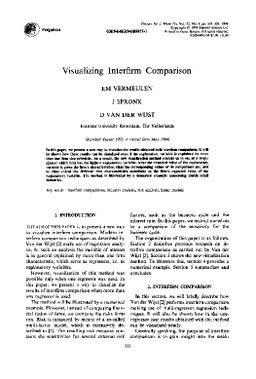
In this paper, we present a new way to visualize the results obtained with interfirm comparison. It will be shown how these results can be visualized even if the explanatory variable is explained by more than one firm characteristic. As a result, the new visualization method enables us to see at a single glance: which firm has the highest explanatory variable, what the expected value of the explanatory variable is given the firm's characteristics, what the corresponding values of its competitors are, and to what extent the different firm characteristics contribute to the firm's expected value of the explanatory variable. The method is illustrated by a numerical example concerning Dutch retail industries.
| Additional Metadata | |
|---|---|
| , , , , | |
| doi.org/10.1016/0305-0483(94)90059-0, hdl.handle.net/1765/6020 | |
| ERIM Article Series (EAS) | |
| Omega | |
| Organisation | Erasmus Research Institute of Management |
|
Vermeulen, E., Spronk, J., & van der Wijst, N. (1994). Vizualizing Interfirm Comparison. Omega, 22(4), 331–338. doi:10.1016/0305-0483(94)90059-0 |
|