2013
The shifting cityscape of Amsterdam - poster
Publication
Publication
Abstract
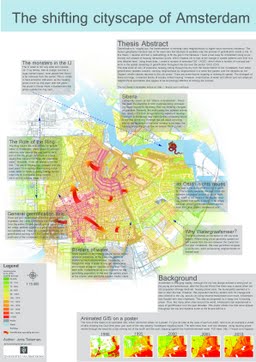
Gentrification is, roughly put, the transformation of working-class neighborhoods to higher socio-economic residency. The human geography literature has so far seen very few attempts to spatially map the process of gentrification inside a city. In this thesis, I develop and test a methodology to fill the gap in the literature. I build a test case for Amsterdam using an extremely rich dataset of housing transaction prices, which enables me to look at the change in spatial patterns over time at a very detailed level. Using these data, I create a number of animated GIS’ (AGIS), which show a number of nuanced patterns in the spatial spreading of gentrification throughout the city over the period 1985-2010. The data show an axis of expensive housing cutting through the city from the Canal District to the Vondelpark, from which gentrification radiates outward, claiming neighborhood by neighborhood in a wave-like pattern over the decades as the (higher) middle classes returned to the city center. There are some factors stopping or slowing its spread. The strongest of these are large, connected blocks of socially rented housing. However, small bodies of water and official (yet non-physical) neighborhood boundaries also appear to be surprisingly effective at slowing the process.
| Additional Metadata | |
|---|---|
| , | |
| hdl.handle.net/1765/77560 | |
| Organisation | Erasmus School of Social and Behavioural Sciences |
|
Tieleman, J. (2013). The shifting cityscape of Amsterdam - poster. Retrieved from http://hdl.handle.net/1765/77560 |
|